Distributed Tracing in Rust, Episode 4: correlating logs and traces
In the previous episodes we coverd logging basics, tracing basics and inter-service tracing. Now it is time to finish up this series with explaining how to correlate logs and traces.
Why should we bother? Well, if we think about an ERROR level log event, we hopefully get a nice error message and some additional fields, but what about the bigger context? Wouldn’t it be useful to know the complete flow of execution through the system from end to end, i.e. the trace, during which the error occured, with all its additional fields, in particular from higher up in the call stack?
In order to achieve that goal, we simply have to add the trace ID as field to every log event. But of course we do not want to do that manually and luckily this is not necessary at all.
As the Tokio tracing framework only knows spans, we have to use tracing-opentelemetry to get from tracing spans to OpenTelemetry spans and from there to OpenTelemetry traces:
1 | /// Recorcd the OTel trace ID of the given request as "trace_id" field in the current span. |
We can use this function taking a Request and returning it unchanged, thereby recording the OpenTelemetry trace ID as a span field, as an addtional layer for hello-tracing-gateway and likewise for hello-tracing-backend:
1 | ServiceBuilder::new() |
In order to make this work, we have to reserve an empty "trace_id" field on each span, though. Hence we update our make_span functions:
1 | fn make_span(request: &Request<Body>) -> Span { |
Finally we have to make sure that log events are written including the stack of spans within which they occurred. Actually that is already the default for the JSON formatter layer we are using; this behavior could be changed via fmt::layer().json().with_span_list(...).
As a result of all this, log events are written like this:
1 | { |
Notice the trace_id field on the topmost span. This is already very helpful in “manually” correlating log events across the call stack and across different services. But, depending on the capabilities of the telemetry backend of choice, there should be a deep integration between logs and traces such that we can navigate from one to another.
Grafana Cloud – using Loki for logs and Tempo for traces – can do this out of the box without any further processing of the log or trace events:
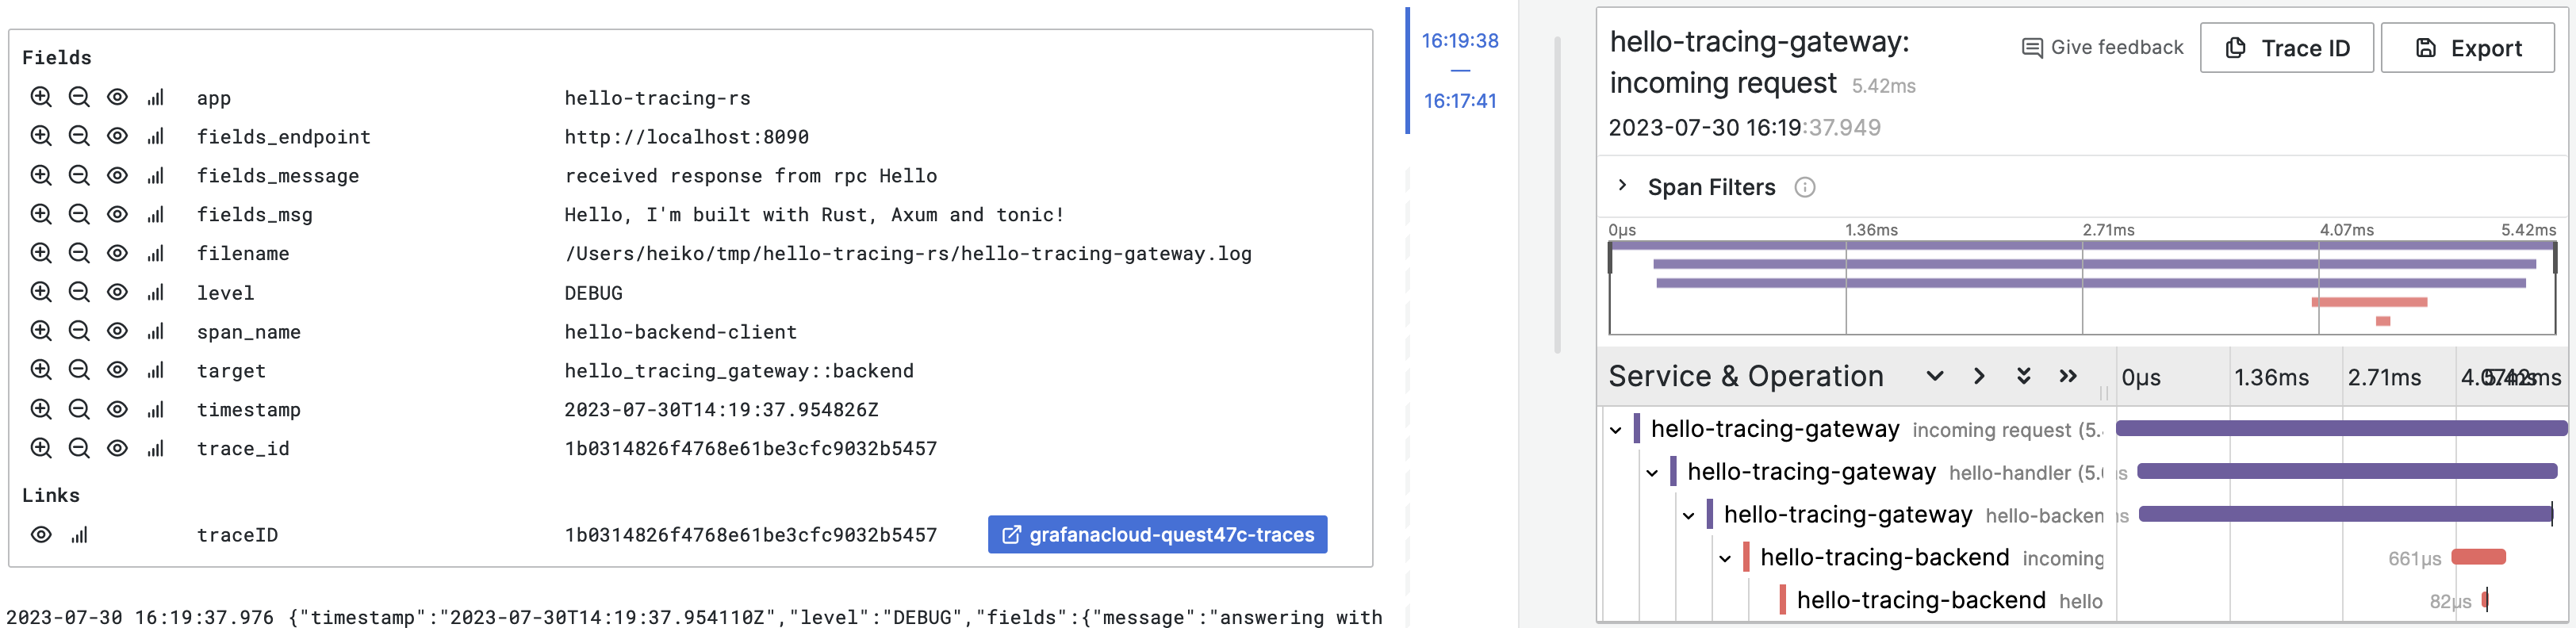
This picture – the same like in the first episode – shows a structured log event on the left and an associated trace on the right. Notice the blue button at the bottom of the left half, right of the trace ID, which is a link pointing to the traces. Similar links taking us to the corresponding logs exist for the visualization of traces if we drill down into a particular span to show its details.
We finally have arrived at the end of this series. Thank you for staying around until here. Let me know if you have any questions. And of course the example code can be found at hello-tracing-rs on GitHub.