Distributed Tracing in Rust, Episode 1: logging basics
In order to gain insights into the inner workings of a system – put another way: to have obervability – we can build upon the three pillars of observability: logs, traces and metrics.
In this series we will explore how we can implement the first two – i.e. logs and traces – in Rust with the Tokio tracing framework and OpenTelemetry.
Let’s start with some boring basic terminology:
- A log event – aka log message – signifies something that has happened at some specific moment in time.
- A span records a – likely partial – flow of execution through a system and hence represents a period of time. It also functions as context for log events as well as parent for sub spans.
- A trace represents a complete flow of execution through a system from end to end, e.g. from receiving a request to sending a response. Hence it is also a span without parent spans, i.e. a root span.
Log events give us valuable insights about what has happened, e.g. not being able to call a downstream service in a multi-service architecture. But without traces it often is hard to understand the context, i.e. the why, e.g. how the request looked like or what the various arguments in the call chain leading to the failing call were. Therefore it is very important to use both logs and traces and to make sure they work seamlessly together.
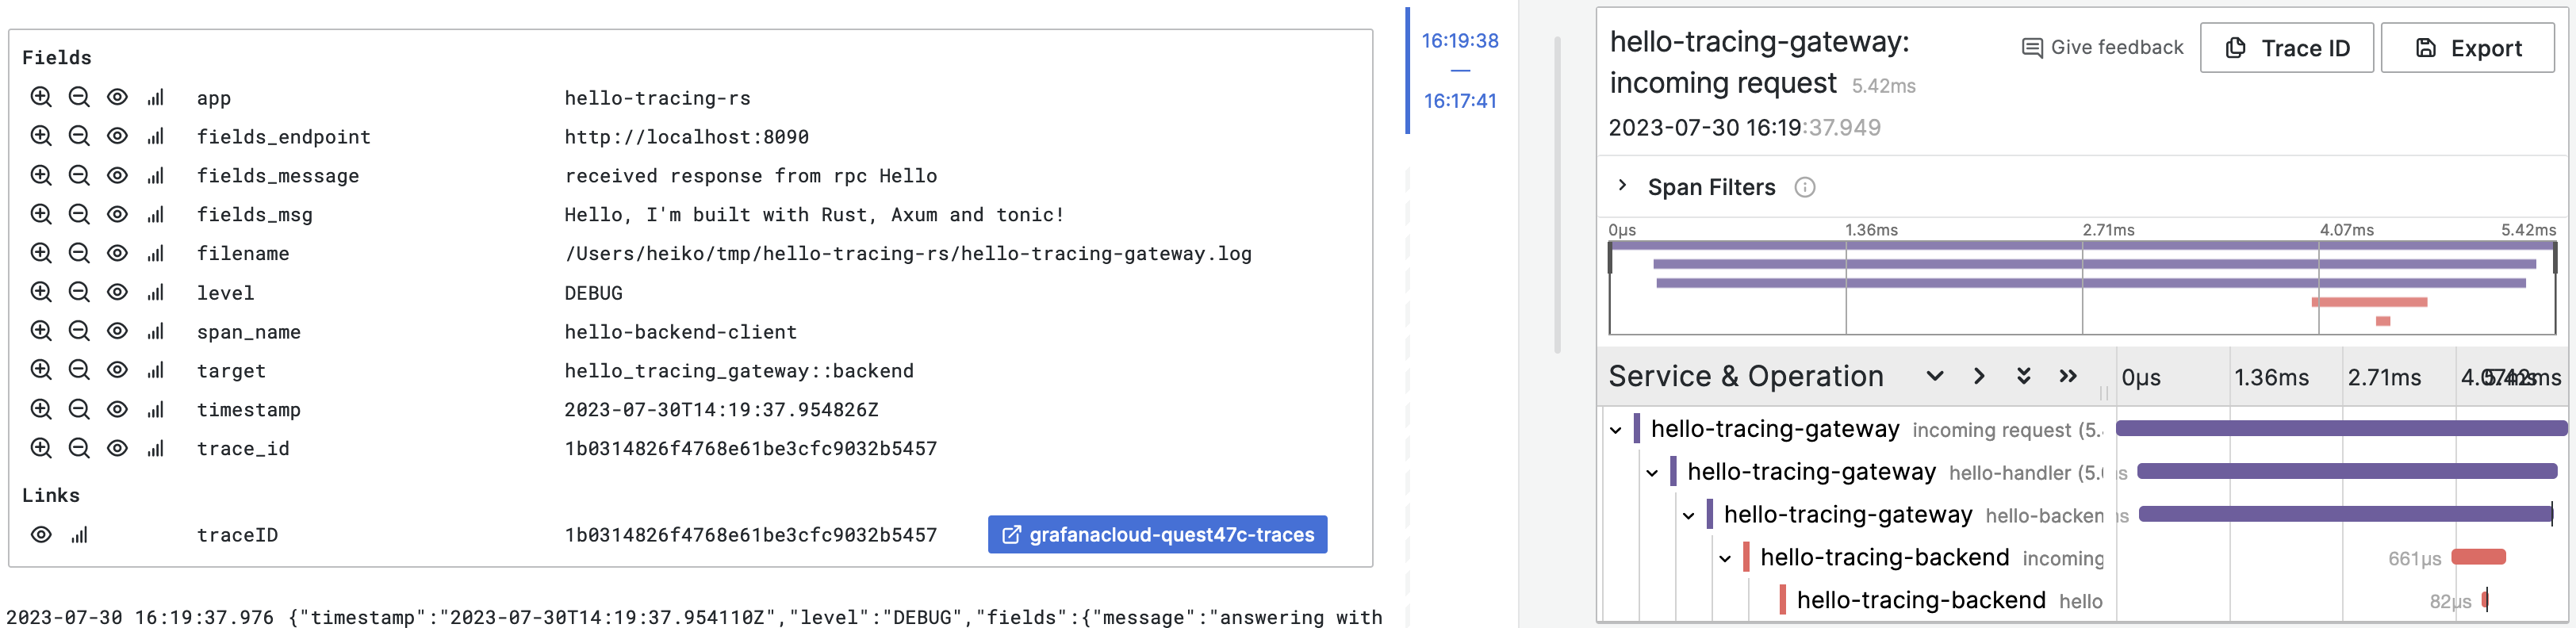
The following picture shows a screenshot from Grafana Cloud with a structured log event on the left and an associated trace on the right:
In this episode we are looking at the basics of logs with the Tokio tracing framework. The next episodes will cover traces as well as correlating logs and traces.
To create a log event in code, the tracing crate provides macros for the respective levels, e.g. debug! or error!:
1 | debug!(?config, "starting"); |
Beside the level and message we can add arbitrary fields and such get to rich and strucutred log events. To add a field we can use name = value or just name, if name is in scope. The supported types are most basic ones, e.g. i32 and String; by using the ? prefix, a type’s Debug implementation is used and % makes use of a type’s Display implementation.
In order to emit log events created in code like above, we use the tracing-subsciber crate. It’s fmt module offers various formatters out of which the JSON one is great for structured logging. To use it, we have to initialize the tracing-subsciber accordingly:
1 | tracing_subscriber::registry() |
tracing-subsciber implements a pretty sophisticated layer architecture, which we will use later in greater depth, but for now the above only applies a filter layer which is initialized from environment variables – RUST_LOG can be used to set per module/target levels – as well a formatter layer that logs JSON formatted representations of tracing events.
Here is an example of a log event created by the tracing-subsciber initialized like above, assuming RUST_LOG is either set globally to debug or at least for the given target hello_tracing_gateway:
1 | { |
All right, we have arrived at the end of this episode. In the next one we will look at traces. If you are interested in – the already fully fleshed out – example code, take a look at hello-tracing-rs on GitHub.