Distributed Tracing in Rust, Episode 2: tracing basics
In the previous episode we were looking at the basics of logging with the Tokio tracing framework; now we are covering tracing.
As a quick recap, a trace represents a flow of execution through a system in some period of time. It is made up of at least a root span covering the complete flow and potentially one or more sequential sub spans which themselves can contain sub spans. More details and a formal specification can be found at OpenTelemetry.
The following picture shows a simple example of a trace visualized with Grafana Cloud involving two services:
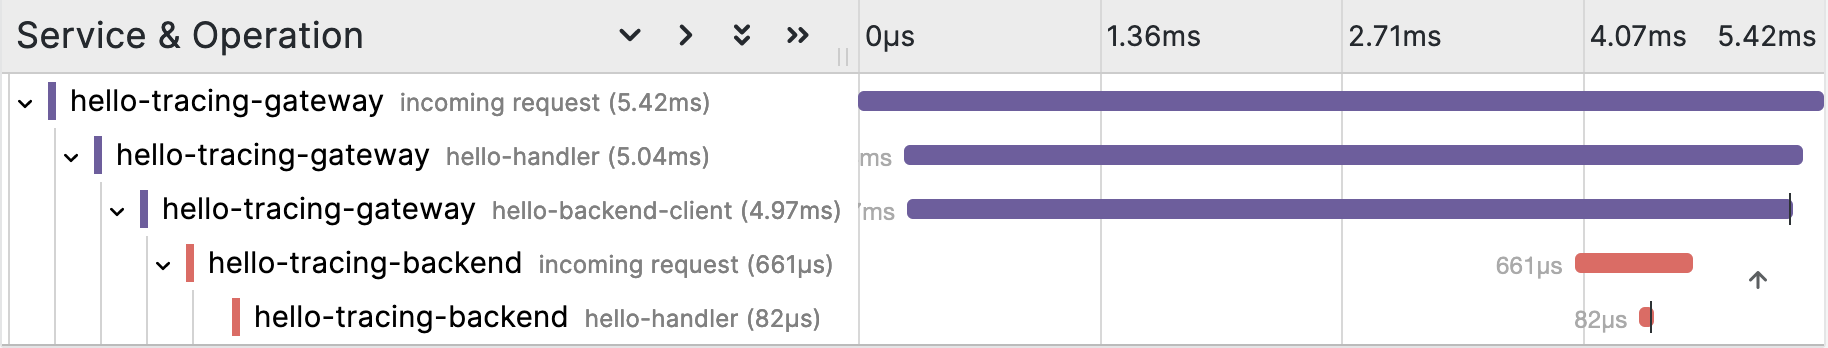
To understand this trace, we have to understand how to propagate trace information – the so called trace context – across services. But before that, let’s see how we can create spans in code, for which the tracing crate provides two ways: programatically and via the instrument attribute. The latter is easy to use and convenient to add spans to functions:
1 |
|
Here a span with INFO level (default unless overridden) named hello-handler (default is function name) is entered when the hello function is called and exited when it returns. By default all function arguments are recorded as span fields, but with skip we ignore app_state.
Sometimes it is necessary to create spans programatically. Our services use the tower-http crate to add a TraceLayer to our axum based web server. That TraceLayer creates a span for every received request which we customize the following way:
1 | TraceLayer::new_for_http().make_span_with(make_span) |
We use the info_span! macro to create a span with INFO level, we name it "incoming request" and we add the headers – its Debug implementation via ? – as field.
Now we know how to create traces inside a single service. But what about inter-service communication? And how can we visualize traces? This will be covered in the next episodes. The already fully fleshed out example code can be found at hello-tracing-rs on GitHub.